 Use USE
 SUN HOURS
 Density DENSITY
 Age AGE
 Green & water GREEN
 Roads ROADS


40.7040 N · 74.0125 W · r 1,640 ft
Pick a site
Search an address or click the map. Parcels and boundaries work too.
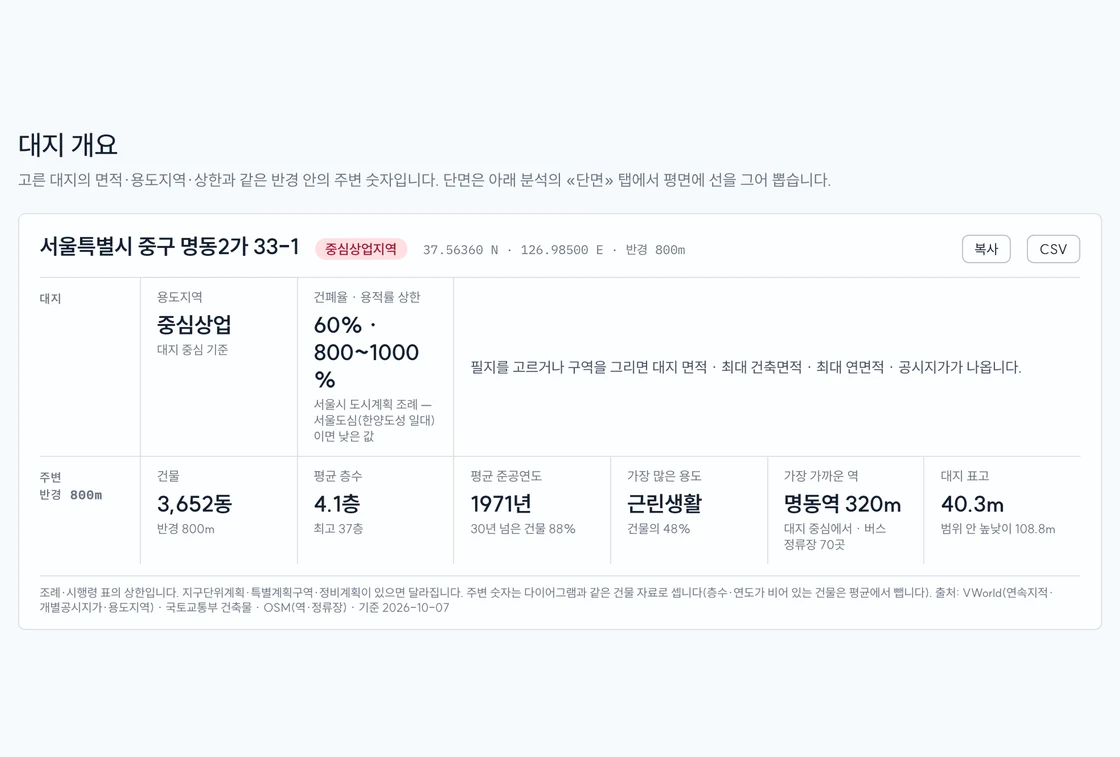
Site overview
Site area, zoning and limits for the chosen site, with figures for the area around it. Draw a section line on the plan in the Section tab below.
Diagrams
Recolor any panel; toggle use/age categories individually.
When you use these diagrams, include this line.
Analysis
3D massing, sun and shadow, wind, thermal comfort and building mix for the same site and radius.
3D massing, sun and shadow, wind, thermal comfort, section and building mix need a large screen and run calculations, so they don't open on a phone.
- Address
- sitedia.app
- Site
Open this address on a computer, search the same site and make the diagrams.
Building mass
Uses the site, radius and shape picked above; clipped at the boundary.
Drag to orbit · wheel to zoom · right-drag to pan.
Colors and on/off by category
Buildings with no height or floor count are not built, so the count is lower than the flat panels. More →
Sun & shadow
Sun path and shadows on the same model as the mass view. Build the mass first.
Drag to orbit · wheel to zoom · right-drag to pan.
Sun position is computed from the site's coordinates (standard time, no DST). Only standing buildings cast shadows — this is not a statutory daylight review. More →
Wind
A wind rose for the nearest weather station — how often the wind blows from each of 16 directions, and how hard. Observed frequencies, not a simulation.
GPU lattice-Boltzmann (LES), prevailing direction only — an early-design reference, not a validated wind study. Terrain is in the model (elevation data); trees are not.
Regional wind from a station miles away, not this site — read it for prevailing direction and season. More →
Thermal comfort
UTCI — how hot it actually feels where a person stands. Air temperature and humidity from the weather file, wind from our own simulation, sun and shade from the building model.
UTCI folds air temperature, humidity, wind and radiation into one number — what the body actually feels. About 48–79°F is comfortable; heat stress starts at about 90°F.
Tree height is assumed at 26 ft and pedestrian wind uses the 20 ft value — compare places, don't quote the numbers. More →
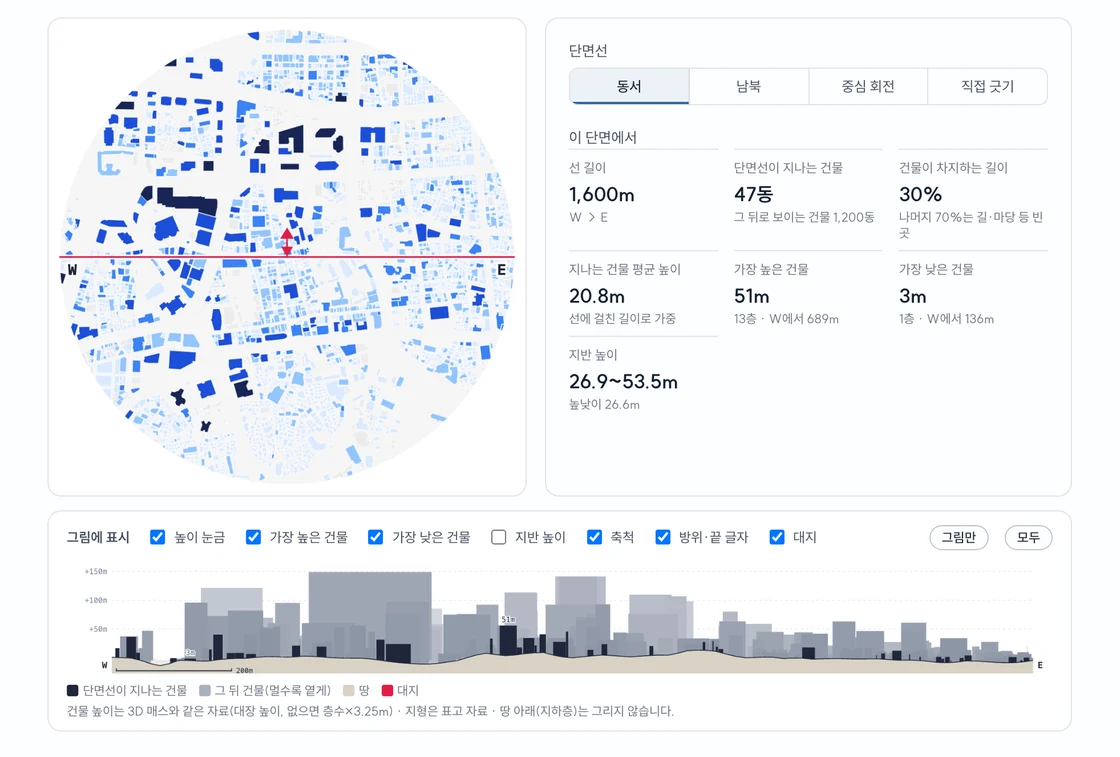
Section
Draw a section line on the plan to cut a section and skyline right below it. Vertical scale 1:1.
Click or drag on the plan to move the section line there.
Buildings cut by the lineBuildings behind (lighter = farther)GroundSite Building heights use the same data as the 3D massing · terrain from elevation data · nothing below ground (basements) is drawn.
Breakdown
How many buildings, and what share. Same data as the diagrams above — colours follow the palette you set there.
Guides All guides · FAQ
 Site overview
 Analysis 05 · Section